Tuesday, May 12, 2015

Trouble Connecting Apache Spark with Hbase due to missing classes

Ideally when you try to connect HBase with Apache Spark, in most of the cases, it throws exception like ImmutableBytesWritableToStringConverter or Google Utils not found and various other errors while trying to run.

Almost all belongs to the same family of missing drivers.


To solve it straight forward,


Just go to spark-defaults.conf

update your spark.driver.extraClassPath with required libraries. keep on adding them.

like for missing ImmutableBytesWritableToStringConverter , add spark-examples-1.3.1-hadoop2.4.0.jar.


spark.driver.extraClassPath /Users/abhishekchoudhary/anaconda/anaconda/lib/python2.7/site-packages/graphlab/graphlab-create-spark-integration.jar:/Users/abhishekchoudhary/bigdata/cdh5.2.0/hbase/lib/hbase-server-0.98.6-cdh5.2.0.jar:/Users/abhishekchoudhary/bigdata/cdh5.2.0/hbase/lib/hbase-protocol-0.98.6-cdh5.2.0.jar:/Users/abhishekchoudhary/bigdata/cdh5.2.0/hbase/lib/hbase-hadoop2-compat-0.98.6-cdh5.2.0.jar:/Users/abhishekchoudhary/bigdata/cdh5.2.0/hbase/lib/hbase-client-0.98.6-cdh5.2.0.jar:/Users/abhishekchoudhary/bigdata/cdh5.2.0/hbase/lib/hbase-common-0.98.6-cdh5.2.0.jar:/Users/abhishekchoudhary/bigdata/cdh5.2.0/hbase/lib/htrace-core-2.04.jar:/Users/abhishekchoudhary/bigdata/cdh5.2.0/spark-1.3.1/lib/spark-examples-1.3.1-hadoop2.4.0.jar:/Users/abhishekchoudhary/bigdata/cdh5.2.0/spark-1.3.1/lib/spark-assembly-1.3.1-hadoop2.4.0.jar:/Users/abhishekchoudhary/bigdata/cdh5.2.0/hbase/lib/guava-12.0.1.jar


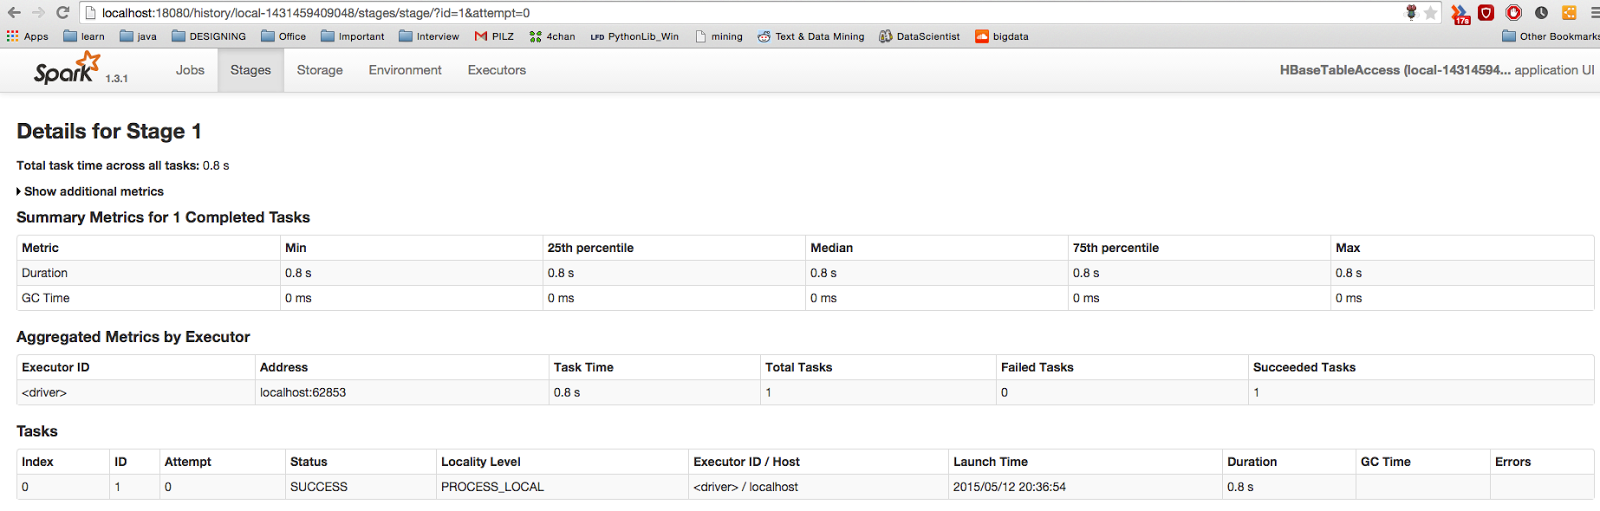
And one more thing , its actually ultra fast to access Hbase using Spark , so real-time updates


Sunday, May 10, 2015

HBase ignore comma while using bulk loading importTSV

HBase simply ignore Text while importing the same with CSV file, and the best part it didn't even inform you.
Entire job will be passed , but your HBase table won't have any data or partial data , like if any column has some values

"this text can be uploaded , but it has more" , then till uploaded it will be there in HBase Table cell , then rest of the contents are gone.
This is because I was importing TSV with seperator comma (,) and that lead to import engine to ignore comma among the csv cell.


It took 32 YARN jobs to figure out the actual issue.

Import CSV command -


create ‘bigdatatwitter’,’main’,’detail’,’other’


hbase org.apache.hadoop.hbase.mapreduce.ImportTsv -Dimporttsv.columns="HBASE_ROW_KEY,other:contributors,main:truncated,main:text,main:in_reply_to_status_id,main:id,main:favorite_count,main:source,detail:retweeted,detail:coordinates,detail:entities,detail:in_reply_to_screen_name,detail:in_reply_to_user_id,detail:retweet_count,detail:id_str,detail:favorited,detail:retweeted_status,other:user,other:geo,other:in_reply_to_user_id_str,other:possibly_sensitive,other:lang,detail:created_at,other:in_reply_to_status_id_str,detail:place,detail:metadata" -Dimporttsv.separator="," bigdatatwitter file:///Users/abhishekchoudhary/PycharmProjects/DeepLearning/AllMix/bigdata3.csv

Monday, March 30, 2015

Internal of Hadoop Mapper Input to customize


Internal of Hadoop Mapper Input 

Well I just got a requirement to somehow change the input split size to the Mapper , and just by changing the configuration didn't help me lot, so I moved further and just tried to understand exactly whats inside -


So above the Job flow in Mapper and the 5 methods are seriously something to do with split size.

Following is the way , an input is being processed inside Mapper - 

- Input File is split by InputFormat class

- Key value pairs from the inputSplit is being generated for each Split using RecordReader


- All the generated Key Value pairs from the same split will be sent to the same Mapper, so a common unique mapper to handle all key value pairs from a specific Split

- All the result from each mapper is collected further in Partitioner

- The map method os called for each key-value pair once and output sent to the partitioner

- so now the above result in partioner is actually further taken into account by Reducer.


So Now I found the class InputFormat to just introduce my change and that is based on my requirement.


But further checking the exact class helped me more -

 @Deprecated  
 public interface InputSplit extends Writable {  
  /**  
   * Get the total number of bytes in the data of the <code>InputSplit</code>.  
   *   
   * @return the number of bytes in the input split.  
   * @throws IOException  
   */  
  long getLength() throws IOException;  
  /**  
   * Get the list of hostnames where the input split is located.  
   *   
   * @return list of hostnames where data of the <code>InputSplit</code> is  
   *     located as an array of <code>String</code>s.  
   * @throws IOException  
   */  
  String[] getLocations() throws IOException;  
 }  


Further there few more things to check like TextInputFormat , SequenceFileInputFormat and others

 Hold On.. We've RecordReader inbetween which splits the input in Key-value and what if I got something to do with it-

RecordReader.java Interface

We can find implementation of RecordReader in LineRecordReader or SequenceFileRecordReader.


Over there we can find that input split size crosses boundary sometimes, and such situation is being handled , so custom RecordReader must need to address the situation.


Tuesday, February 17, 2015

Things to know before Big Data & Machine Learning

When I started with Big data , I started with Hadoop .
When I started with Machine learning , I started with Linear Regression .

But time by time I realized I didn't make the best choice to do so.
why ?????????????????


Because I missed the core of the technologies but even I managed to finish the job but that doesn't mean I did it right. I missed the gap between learning and knowing the technology , I missed the fundamental behind the specific .


So I personally preferred following before Big Data and Machine Learning-

Don't confuse.. well Big Data & Machine Learning are 2 different things but they need each other. And You will know it once you do it :-)


Things to Do before Map-Reduce -


  • First understand Map-Reduce DATASTRUCTURE.
  • Write your own implementation of Map Reduce which is ultra easy without using any framework like hadoop or Spark. 
  • Refresh Graph Technologies like DFS & BFS
  • Explore some basic Dynamic Programming and Greedy Algorithm like Knapsack , LCS, Floyd Warshell , KMP etc.
  • SQL or RDBMS or precisely Data Model , Relational Algebra 


Things to do before Machine Learning -

  • Mathematics 
  • Vector , Scalar
  • Matrix Multiplication , Addition and other basic operations
  • Linear Formulation
  • Probability , conditional and independent
  • Probability Distribution
  • Basics of Permutation and Combination
  • Hypothesis
  • Very basic Statistics like Mean, Median , Standard Deviation variation 
  • Regression


Ok seems like lot to do before you even start of.... Well practically its not.
Everything is either from High School or College, so ideally you just need to refresh your memory and it will actually bring excitement to start with .


Warning : This list is going to grow further :-)


Monday, December 29, 2014

Why did I use BigData Technology (Spark) for Machine Learning (NLP)

BIG DATA WITH NLP 

I am here to do Sentiment Analysis of twitter dataset and trying to make it a generalize platform  irrespective of twitter or any other source , so dimension and size of training data is actually large and it will grow on.

As a developer of Machine Learning, I thought of trying Python as the technology and for trial I was having around 1600000 records from http://help.sentiment140.com/


Why not R?


Well first I found R is not same traditional way of coding so comfort was question but making things in R is extremely easy. So that can't be the only reason to try in python.


Python is nice language and NLTK library made NLP very easy and loads of example are there and at-least NLP is very powerful with nltk library along with that scikit-learn library (machine language algorithms).


Its very easy to code in Python compare to R in my view.

Brilliant support with Hadoop Streaming for python so I will vote up for Python again.

So here I got an opportunity to try something new and thats always exciting :-)

(I am not saying Python is better than R , as I use both of them , in this particular scenario , for me , python stood)

So how to do that ?


Well Sentiment Analysis is not just 1 thing that I get the text and ran algorithm and here we go. Its never like that , once you get data you need to decide polarity on it I mean first need to find 

any statement is positive or negative
Then create a feature set
The find stop words
Then bla bla bla ...
Then finally train it
Then test accuracy
Then finally predict it

I means it has loads of step before reaching the goal so it no way an ordinary task but once you are clear with the concept, its neither tough.

check Text Processing


Whats more ?


So I first tried with small dataset of around 400 records having 100 test records and ran NaiveBayes from nltk


 classifier = NaiveBayesClassifier.train(X_train)  

and it ran in very small time of around 10 sec and then some accuracy test with precision test more 10-20 seconds and thats done.
The file size was approx. 500kb thats all and it took 20 to 30 seconds.


Cool thats brilliant , 30 seconds and all set.
But is it enough ? Are we set ?


Then why do I need Bigdata framework ?

On exploring more I found there is a brilliant sentiment dataset available in sentiment140 and the file size was about 250mb or precisely the records number are 1600000, thats a pretty decent size for getting a proper result of sentiment analysis.

So I was all set and ran the same algorithm with this new dataset or file. The file contains positive and negative statements collected from twitter so I changed the file name and ran the python script.

Damm!!! my system is quite good config even memory exception . What... can't I run this, well no I can't. I tried several times and I tried the same with high config Windows as well as Mac machine and same thing, Memory Error.

So I was left with only one choice , try the same in Bigdata platform and see atleast it must run there and I ran the same program but in Hadoop YARN environment & Spark and finally it ran but at what cost ???
It took more than 14 minutes to finish the job.


So 14 minutes for 1600000 records , but I need to deal with 20 times of this size , how the hell I am gonna do that.
20 * 14 minutes in simple mathematics and that won't happen because resource utilisation , memory factor will anyway raise the time more and more.


So is it really a feasible option?

Now Spark fits here .

Spark has a brilliant library MLlib which contains almost all known popular Machine Learning API's Spark Library
As I already told that I am using NaiveBayes, Spark has already API

So I need to change in the code, because Spark works in the concept of RDD ie resilient distributed dataset RDD Concept

I am surely not gonna explain the changes but I must admit that there were pretty important changes almost everything to parallelise the process the basic concept behind Bigdata framework including Spark.

Now I was set and ran the Spark in my local system and YARn (no cluster) and surprisingly it took around 2.4 minutes and I added more extensive operation on the code and maximum it went till 3.8 minutes. Find below -


Conclusion

In current days, when there is unlimited data source then its very hard to restrict yourself if there are technologies available to handle the size and dimension of data and Spark is an excellent fit for Big Data but in machine learning its not only about running the algorithm but ignoring those now BigData platform or technology stack is actually brilliant source.

So moving on I am going to use Spark for Text processing but I got one more great option GraphLab , so once I try that I will compare Spark and GraphLab and initial research showed me GraphLab is little bit faster than Spark


All my codes are already in github

Proper Sentiment Analysis in Spark
Python NLTK Naive Bayes Example
Analysis in YARN Long Running


Tuesday, November 25, 2014

Use Python for Recommendation Engine


Python For Recommendation Engine

well here Page1 we got the data and we fetched associated details with each of the dataset , alright now lets roll , will just write the algorithm and its done...

Good Morning .. its real world and nothing happens so easily here ..

Why did I say so ?

   Var1 Freq
    N/A  405

Because I have 405 NA values in imdbRating .. it does mean I have no records available for 405 among the list of 1173 total movies.. That sick because then almost 40% of the dataset is invalid.

So what should I do , should I simply dump the data and why it happened.

I can't dump that much data and it happened because there are movies which has no details in IMDB, may be because of some movies are based on particular zone only nt globally known or any other reason.


What Should I Do ?

I will cleanse and shape my data.

Lets consider a movie named KNHN and now I will try to find how many fb friends' like the movie lets say 10, now I can compare that number to the movie having highest viewer among my list ie 3 idiots which is 30.

So now I know among highest number 30% liked KNHN as well , so weightage of this movie is bit high. So naturally is above average rating ie 5.0 , so again I added 30% of highest rating 8.4 to 5.0 and finally I am close to some value around 7.0 (example).

So are we finished here , not possible , there are lot more fields to address like imdbUserVotes , rottenUserVotes. So what should I do here.

Simple I will use linear Regression or precisely Machine Learning ml to do this . Bingo !!!! I used scipy library of python to run polynomial regression-

  result = sm.ols(  
           formula="tomatoUserReviews ~ imdbRating + tomatoRating + I(genre1 ** 1.0) +I(genre2 ** 1.0)+I(genre3 ** 4.0)", data=df2).fit()  
         pretomatoRating = result.predict(  
           pd.DataFrame({'imdbRating': [newRating], 'tomatoRating': [newRating],'genre1':[0],'genre2':[0],'genre3':[0]}))  
         pretomatoRating = int(round(pretomatoRating))  
         if pretomatoRating < 0:  
           pretomatoRating = 10000  
         self.df2.loc[index, "tomatoUserReviews"] = pretomatoRating  


So now my dataset is quite preety


imdbRating imdbVotes imdbID tomatoRating tomatoUserReviews
1 6.20 89960 6.20 3504356
2 6.40 5108 tt2678948 6.30 152
3 6.80 35 tt0375174 6.30 125
4 7.20 99763 tt0087538 6.90 314496
5 6.90 231169 tt1068680 5.30 316060
6 7.70 291519 tt0289879 4.80 621210
7 6.90 174047 tt1401152 5.80 74879
8 7.20 1038 tt0452580 6.30 253
9 4.90 10381 6.30 6006
10 7.20 28 tt0297197 6.30 6006
11 4.90 10381 tt1278160 6.30 6006
12 4.90 10381 6.30 6006
13 4.90 10381 6.30 6006
14 3.20 690 tt2186731 6.30 862
15 6.20 5594 tt1252596 6.30 2436

So now all of my movies have Ratings and user reviews (almost).

So Now I can run my recommendation


Shaping The Final Outcome

Now I have all the required variables in the dataset I can finally run my distance algorithm to conclude which is the next best movie.

For rating as the data is consistent I used euclidean but votes are very sparse so I used consine distance to get the data.

   def calculatedistance(self, movie1, movie2):  
     FEATURES = [  
       'imdbRating', 'imdbVotes', 'tomatoRating', 'tomatoUserReviews']  
     movie1DF = df2[df2.MOVIE == movie1]  
     movie2DF = df2[df2.MOVIE == movie2]  
     rating1 = (float(movie1DF.iloc[0]['imdbRating']), float(  
       movie1DF.iloc[0]['tomatoRating']))  
     rating2 = (float(movie2DF.iloc[0]['imdbRating']), float(  
       movie2DF.iloc[0]['tomatoRating']))  
     review1 = (long(movie1DF.iloc[0]['imdbVotes']), long(  
       movie1DF.iloc[0]['tomatoUserReviews']))  
     review2 = (long(movie2DF.iloc[0]['imdbVotes']), long(  
       movie2DF.iloc[0]['tomatoUserReviews']))  
     # ValueError  
     distances = []  
     distances.append(round(distance.euclidean(rating1, rating2), 2))  
     '''  
                Since votes have sparse data , so i preffered to use cosine rather euclidean..  
                http://stats.stackexchange.com/questions/29627/euclidean-distance-is-usually-not-good-for-sparse-data  
           '''  
     distances.append(round(distance.cosine(review1, review2), 2))  
     return distances  


Python code has -

User Recommendation - recommendMovie
Distance Comparison between 2 movies - calculatedistance
Distance comparison between multiple movies - compareOneMovieWithMultiple
Distance Comparision Among Movies - findSimilarityBetweenMovies

and few more.

One of sample I have uploaded in cloud - Distance Calculated between Movies 

Entire Source Code - git link


Few More analytic in R will be uploaded.


What More Can be done ?

A Lot more like lots of movies I couldn't extract the Genre , so I can get that from using text extraction from twitter and get the best result.

Lots of basic ratings as well can be derived from Sentiment Analysis of the movie name in different crawler.

Recommendation Algorithm can be made more versatile .


Recommendation Engine using Python

What is Recommendation System


Well if you are reading this you anyway know what is recommendation but basically its giving a suggestion to the user based on certain Parameters like in Amazon , on buying books it gives you suggestion , in IMDB on checking any movie, it gives you recommended movies etc.


Now lets think how is that possible?

Answer - its Science or I must say Mathematics.

Let's play with some normal logic here-

Lets consider Movie 'The Godfather'

Now if somebody likes the same, can we recommend the same user any superhit comedy movie ... aah Naah... Not possible , so naturally we would like to recommend next best movie under Genre Crime or Drama or Thriller.
So thats a recommendation.

Hold on!... As a human I can search and find but hows is that possible using computing languages.

So now we got a point and I'd like to push you all in past , schooling days.
'Euclidean Distance or Manhattan Distance' ..

Are those words seems to be familier to you .. well at first sight it may be like "What d hell this guy is talking about" or what ... why should I know mathematics here.

Because its mathematics only :-)

The distance between two points in a grid based on a strictly horizontal and/or vertical path (that is, along the grid lines), as opposed to the diagonal or "as the crow flies" distance. The Manhattan distance is the simple sum of the horizontal and vertical components, whereas the diagonal distance might be computed by applying the Pythagorean theorem.

For more details , Google and know the actual concept behind them. That's important.


What Exactly I did with R and Python

I used R for do quick analytics on my data and used python to write the main algorithm behind it.
I must say everything I did in Python, I could have been done in R as well but I used python because I am little more comfortable in programming language rather than scientific one ie R. My personal opinion and please don't believe me :)


Concept behind the entire approach

If I have a collection of movies , then I can extract details about each of the movies like user ratings , reviews , Genre and all other things easily and if that is possible then I can use any distance algorithm like euclidean to find the similarity between any 2 movies.

Now I will pick the movies in each of my friends' list from facebook and then will compare the same with the list of unwatched movies and sort them based on distance , so now I have a list of movies recommendation start with the best till the end.


Is it actually so easy ????


Explanation based on Programming

First I connected to Facebook using Oauth and REST so that I could get access to my friends and then the movies liked by my friends.


 graph = facebook.GraphAPI(access_token)  
 profile = graph.get_object("me")  
 friends = graph.get_connections("me", 'friends')['data']  

Then I used algorithm to get movies like by my friend


 allLikes = graph.get_connections(friend['id'], "movies")['data']  


Now next job is to get the details about which of the movies like rating and all other things and finally I got following contents-


MOVIE Year Released Genre Director Poster imdbRating imdbVotes imdbID tomatoRating tomatoUserReviews BoxOffice
2 Jilla 2014 10/01/14 Action, Drama, Thriller R.T. Neason http://ia.media-imdb.com/images/M/MV5BOTUxNzExOTA0NF5BMl5BanBnXkFtZTgwMTUzNTAxMjE@._V1_SX300.jpg 6.4 5108 tt2678948 N/A 152 N/A
3 Pursuit of Happyness 2005 16/07/05 Documentary Patrick McGuinn http://ia.media-imdb.com/images/M/MV5BMTk4NjQ2NzI5Nl5BMl5BanBnXkFtZTcwOTIzNTM0MQ@@._V1_SX300.jpg 6.8 35 tt0375174 N/A 125 N/A
4 The Karate Kid 1984 22/06/84 Action, Drama, Family John G. Avildsen http://ia.media-imdb.com/images/M/MV5BMTkyNjE3MjM2MV5BMl5BanBnXkFtZTYwMzY5ODk4._V1_SX300.jpg 7.2 99763 tt0087538 6.9 314496 N/A
5 Yes Man 2008 19/12/08 Comedy, Romance Peyton Reed http://ia.media-imdb.com/images/M/MV5BNjYyOTkyMzg2OV5BMl5BanBnXkFtZTcwODAxNjk3MQ@@._V1_SX300.jpg 6.9 231169 tt1068680 5.3 316060 $97.6M
6 The Butterfly Effect 2004 23/01/04 Sci-Fi, Thriller Eric Bress, J. Mackye Gruber http://ia.media-imdb.com/images/M/MV5BMTI1ODkxNzg2N15BMl5BanBnXkFtZTYwMzQ2MTg2._V1_SX300.jpg 7.7 291519 tt0289879 4.8 621210 $57.7M
7 Unknown 2011 18/02/11 Action, Mystery, Thriller Jaume Collet-Serra http://ia.media-imdb.com/images/M/MV5BODA4NTk3MTQwN15BMl5BanBnXkFtZTcwNjUwMTMxNA@@._V1_SX300.jpg 6.9 174047 tt1401152 5.8 74879 $63.7M
8 A Year Ago in Winter 2008 06/01/10 Drama Caroline Link http://ia.media-imdb.com/images/M/MV5BMTQ4MTUzNTIwM15BMl5BanBnXkFtZTcwMTEzMjA0Mg@@._V1_SX300.jpg 7.2 1038 tt0452580 N/A 253 N/A
10 James Bond 007 1983 N/A Adventure, Animation, Action N/A N/A 7.2 28 tt0297197 N/A N/A N/A
14 Department 2012 18/05/12 Action Ram Gopal Varma N/A 3.2 690 tt2186731 N/A 862 N/A
15 Ajab Prem Ki Ghazab Kahani 2009 06/11/09 Comedy, Romance Rajkumar Santoshi http://ia.media-imdb.com/images/M/MV5BMjA0NjAwNzYxOV5BMl5BanBnXkFtZTcwNzA4NTk5Mw@@._V1_SX300.jpg 6.2 5594 tt1252596 N/A 2436 N/A


Entire code to get the data can be found facebook_movies_dataset

Since now I have data, so why not run some quick analytic on them and see have I really did any good job -


So from the graph above , we can easily see that 3 idiots is the most viewed movie among my FB movies list and Gaurav Shr.. has liked the most number of movies , so naturally he doesn't have any work :)


Source Movies_Analytics


So Now I have dataset which give me some values and and now I can work on my recommendation engine... if you have taken some breath .. lets move on to next important thing ... what to code and how to shape the data...

'This is my first-ever program in Python, so can't claim it as a very great code'

Part2


Wednesday, November 5, 2014

Quick analysis on new Mobile available in Market and Sentiments using Twitter api


Phone Analysis and Sentiment

Heard lots about iPhone6 and now Nexus 6 , so finally I decided to try my first ever twitter analytic test using R and the objective is to find how people are talking about these phones.

Well to honor Samsung , I added it too.

Few things to know before starting twitter analytic using R (not from expert point of view) -

1. Its Very easy and R will make your life ultra easy. Python is as well great for the same but I will post about that sometime later.

2. To do quick analytic there is no point of running behind BigData , simply use less records and do the job.

3. Number of records does change the fate of your analytic , so its always good to run the same on large data volume so do this step once your bigdata setup is done and you already have experience working on casandra , spark etc.

4. To learn this you just need to know any technology and you must love technology, then learning R and do Rstats won't be trouble.

5. Some basic libraries like 'twitteR' , 'plyr' , 'stringr' and 'ggplot2' for twitter and statistics, do some basic hands-on on them and then roll.

6. If you are good in mathematics , that wonderful but you need not to be best in that, just basic school mathematics concepts are enough for starter..atleast what I felt.

Once I ran the stats-


Great iPhone still leads in all +ve side and Nexus 6 based on data , actually not getting that positive vibe , well then why i heard that ...

Again all these stats can change a lot if I try the same with more data.


The source code with comments are already uploaded in my github RsourceFile, just explore ..

Happy Coding..


Monday, October 27, 2014

Some interesting things about Regression

Residuals


Once we run the linear regression model, we get residuals as summary, so to determine more about residuals, there are some interesting points I accidentally found and it helped me so I am drafting ...


  • Residuals, have mean Zero so it does mean that residual is balanced among the data points , so no pattern its just scattered and there will almost equal positive and negative.


so if I run the linear regression in R-

fit <- lm ( relation ~ person , data = people) ,

so to justify the theory , just do the simple mean of residuals-

mean(fit$residuals) - must give a value very close to zero.


  • There is no correlation between residuals and predictors.

cov(fit$residuals, people$person)

covariance


While googling I found a new equation -


  • var(data) = var(estimate) + var(residuals)


Least Square

Regression line is the line through the data which has minimum (least) squared 'error', the vertical distance between actual predictor and the prediction made by line.
Squaring the distances ensures the data points above and below the line are treated the same.

The method of choosing the 'best regression line' (or fitting a line to the data) is known as ordinary least squares.


Thursday, October 16, 2014

Why did I try Residual Plot over my dataset

Why Residual Plot


Well I had previously a sick data of India Population, which was correct but I altered it and made it worst. So now the population based on year is linear increasing suddenly it touched the pinnacle so ideally this data is never meant for Linear Regression but bound with my habit , I ran linear regression on them and found this -


Ok above is the linear line I got and that is terrible , believe because I ran the predictor and I got brilliant bad result :(

For year 1800,2030,2040 I got 
     1         2         3 

-11839.78 824736.40 861109.28 

So it does man there was no India in map :O , what that's not possible I messed it up ...
Well i already mean it to make the data work properly , but nothing helped.

So Now I knew that I need to transform my data to some format so I searched on internet and found some keyword named Residual Plot.


Well, what again new concept, why should I learn this....

Residual is the error between an actual value of dependent variable and predicted value. So avoiding all these mind blowing keyword behind , I finally derived that its a way to find a model is a 'good fit' or not.

There is 2 very basic and easy thing to remember in residual plot-
 1. The residuals for the 'good' regression model are normally distributed, and random.

 2. The residuals for the 'bad' regression model are non-Normal, and have a distinct, non-random pattern.


So from above , we can see a sure-shot case of bad data and model and I know surely this model is bad as my model definitely shows a pattern, superb pattern of growing....


More , by chance I need more-

If I know this far, I must draw a conclusion by drawing some example with a good fit of data within model , lets see hows residual looks-

Following Sample data -

x <- runif(100,-3,3)

y <- x+ sin(x) + rnorm(100,sd =.2)


and I got -


Good one, isn't it , but lets not be in hurry, lets see the Residual plot-


What I can see a pattern now , I sin wave, ahh... so it says the model looks to be good but it not, so just don't go with scatter plot or model, there may be trouble inside, there is no harm to run the residual plot .